A smart trading journal and trader's diary. Your trades are collected into statistics and automatically broken down into dozens of analytical views.
Trade statistics are collected and automatically broken down into dozens of detailed analytics.
The service brings together everything you need for a high-quality overview of your trading activity: important benchmarks, charts, graphs of various relationships, spreadsheets, and more.
Nine reasons to keep your statistics here

By excluding negative results from your trading and by reinforcing what works, you can improve your material expectations, profitability and earnings.

The time spent on adding trades and doing a daily analysis develops a trader's most important qualities: discipline and self-control.

It provides smart analysis, maximum information, and quick adoption of what you need for success. Businesses today cannot allow things to get out of control.

This helps a trader understand the path that he or she has taken, analyze it, and understand their feelings, desires, and fears. It keeps your thoughts in order, calms your nerves, and safeguards the information that you need.

It provides the ability to respond quickly to changing circumstances. The service allows you to detect where your system is starting to fail and which aspects of the dynamic are becoming worse.

The service helps fine-tune strategies through testing on historical data. It allows you to identify undesirable interrelationships and to correct these parameters.

Fixing a mistake by allowing you to remember it and not repeat it. Application tools provided include comments, ratings, screenshots, and the ability to choose only erroneous trades.

When trading, it is important to have a basic idea of how everything is arranged: tools for evaluating your profitability, drawdowns, important factors, statistical approaches, and money-management strategies — all in a visual representation.

You'll gain the experience that you need to be on top of everything you do. Get informed results, not random ones, and reach your maximum potential.
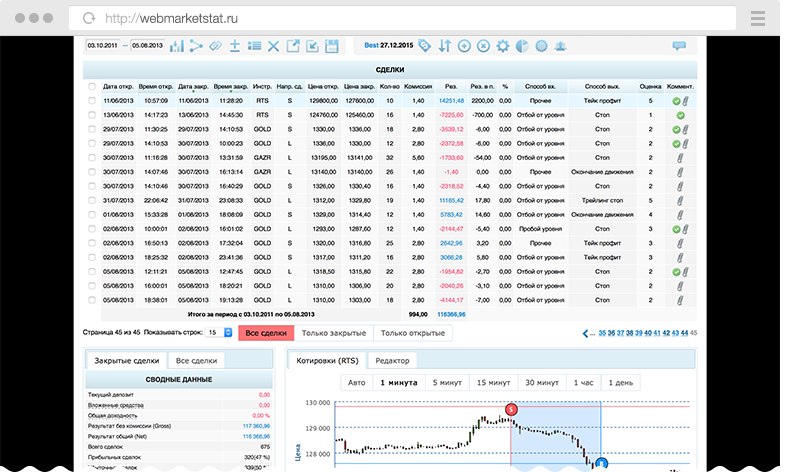
How the service turns a list of trades into analytics. Screenshots are clickable
We represent trading history as trades. Each trade consists of two or more orders and has input and output parameters. Trades can be grouped, filtered and sorted.
For each analytics group smart filters are available. By using filters you can:
* Section of trading — method of entry, strategy, signal used, time during trading day, drawdown below a specified level, day of the week, mood, etc. (many are configurable)
Trades can be:
11 analytics groups — pick an icon to see the details
The dashboard shows important indicators and charts on one page.
You can import trades from your brokerage statement. It takes an average of 10 seconds to import trades. You can add custom fields for more detailed statistics.
A complete overview of your trading. We have developed dozens of ways to illustrate what is really going on with your deposit.
Find out what your yield on investment is and see the dynamics of how your portfolio changes by date. The yield is calculated for a particular day as well as a total yield taking the supplied and withdrawn funds into account.
Overview of aggregated data from completed trades.
How everything relates in time is presented in the form of convenient tables and charts.
Choose instruments for your trading which offer the greatest success and learn the reasons for failure. The tables and charts clearly show the results of each tool and sector.
Use additional analytics to fine-tune your strategy and precisely identify patterns in your trading.
See how your results would change by using different methods of managing your capital.
Get to the bottom of problems with dynamic filters.
A powerful instrument that lets you isolate any pattern in your trading. The filters are highly visual: values are colored according to the result of the trades for a given parameter, so the whole picture across many parameters can be judged at a glance.
All charts and tables are rebuilt when you change the checkboxes in the filters — so you can see how your trading would have looked with some parameters excluded.
A key tool for any trader is a diary.
Its main purpose is to help a trader deal with their inner challenges: fear, anxiety, greed and other emotions that get in the way of trading well and profitably.
Regularly analysing your emotions helps to build the habits that support profitable trading.
The numbers behind 16 years of the service

10,152 traders from 27 countries work on their results every day

We are recommended by Finam, Otkritie, IT Invest and many others — 410 partners in total
32 charts, 46 diagrams, 21 spreadsheets and 37 digital indicators across 6 analytical categories

We import statements from 47 brokers and 40 different trading platforms for 5 exchanges

We can be reached through a variety of contact methods: online chat, telephone, Skype, e-mail

Our service is located on our own high-end servers, ensuring reliable access

We save our clients' time by importing brokerage statements and visualising their trades

We have a lot of sincere, grateful feedback from our users
Swipe — there are more
 Anuar Alpiev
This service is very convenient. It's got everything for a competent analysis of my trades from A to Z. I've been using this service myself and I'm very happy with it. Honestly, my trading has become much better and more stable.
Alexander YurchenkoMy statistics just blew me away. I'm working now on corrections to my trading system based on the information from the statistics. I don't know why I didn't pay attention earlier to a full-on trading reporting program. Thank you for developing such a report tool.
Denis SabatinAs for me, it is a great opportunity to explore your weaknesses and the bad sides of your strategy. Marketstat can show you what you are really worse at in trading. It's like a SWOT analysis in business management. A great number of tools will help you improve your trading strategy.
Click a feature name — the details will open in a pop-up window
1 year
$100 / year

Special terms are available for regular customers, groups of traders, contests, and corporate clients. For further details, contact us through the online assistant.

